Monday, February 26, 2024

This Well Positioned TAOST Stalk Candidate Reports in 3 Days

Most people choose to buy stocks by the seat of their pants. 

Because you heard a rumor...

Because this bank or that put out a glowing report...

Because you like the company's product[s] and assume everyone else does as well.

Having been at this for awhile, I've learned that the best way to trade [also known as the most profitable] is simply and following the same few patterns day after day... trade after trade.

Today's candidate is exactly that.  It follows one of the many patterns I've used for the last 20+ years to extract profits from the market.

It has a beta [A beta that is greater than 1.0 indicates that the security's price is theoretically more volatile than the market] of 1.66.

And it reports in 3 days.


 You're welcome.

Saturday, February 17, 2024

I Didn't Expect This Stock To Sail Higher

Royal Caribbean Cruise Ltd [RCL] has had a nice run over the last several months rising from below $40 in mid-2022 to well above $100 this year.  The stock looks set to find support at around $112 or, in the worst case, at $100.


Saturday, November 25, 2023

SPY Index ETF Update 25 November 2023


After fighting off the negative price action over the course of most of 2023, the S&P500 looks to be in full swing to move higher and eclipse the recent swing high and, perhaps ultimately the all-time high put in the week of 24 July 2023.

While November's candle is not complete just yet, the strength of the candle with just a few days to go suggests the move is both real and destined to continue.

Wednesday, March 30, 2022

SPX 500 Headed Into The Last Trading Day of March 2022

One of the most common [and reliable] chart signals happens at the end of a month, quarter or year.

That signal? 

Buyers taking stocks and, consequently, indices higher.

Given the market has made a strong, multi day move higher, made a higher high and breached TAOST Balance Zone to the upside, the index may take a breather, but don't be surprised if price resumes its upward trek in short order.


Wednesday, January 30, 2019

AT&T [$T] 30 January 2019


Always beware of a stock that's down when the overall market is up substantially.  

It's often a telltale sign.  

Both the S&P500 and the DJIA were both up more than 1.5% while $T was down more than 4%.

The chart shows a long term bullish price pattern that failed.  It's not likely to repair itself.

Friday, January 18, 2019

AAPL Update As of 18 January 2019

AAPL reports on 29 January 2019.

Things don't look good for the stock right now.

The broader stock market has been on a tear since Christmas, but Apple's stock can barely get up off the mat.  $140 and TAOST Low Power Zone look like good support, but nothing can hold up a market determined to collapse.


One of my favorite trading strategies historically was to buy stocks that went up when the overall market went down.  It stands to reason that 1 should sell stocks that can't go up alongside the broader market... especially when the stock is supposed to be a market leader.

I say all that to say that it appears to me that Apple is in trouble.

Only the future will tell.

NFLX Responds To Support & Resistance Principles


Netflix put in a nice sell signal against resistance (including TAOST Magnet Zone) on the 5 minute chart a little while ago.

The principles work...

Wednesday, January 16, 2019

SPX, DJIA & GS Update - 16 January 2019

S&P 500


DJIA

It's not quite time to go all "horns up" folks.

To be sure, the bounce has been "strong like bull."  But, as the charts above show, structurally, the broader stock indices aren't out of the woods just yet.

Both the SPX and the DJIA are only just challenging TAOST Magnet Zone™ (TMZ) from below.  Price is already stretched to the upside, so beware of getting long here.  In fact, don't be surprised if price rolls over and traces out lower prices... in fairly short order.

GS

The Goldman Sachs daily chart shows that today's 10% move higher only pushed price toward significant resistance above in TMZ and a separate long running resistance zone.

The selloff may indeed be over... but make sure price validates such a thought by closing above these areas of resistance.

Tuesday, January 15, 2019

Big Companies Reporting Tuesday 14 January 2019 -- JPM, WFC, DAL and UAL

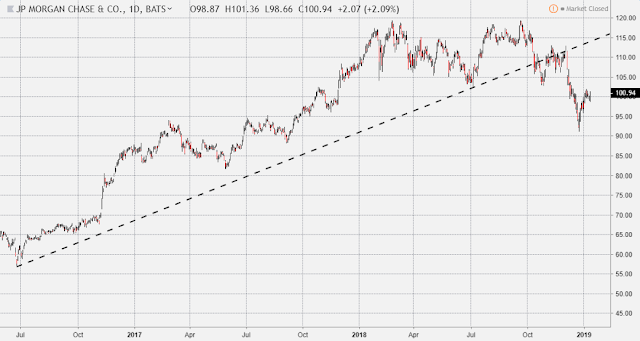
JPM -- JP Morgan has work to do to get change from its negative structure on the daily chart.


WFC -- The red horizontal line was support... and is now resistance.


DAL -- Like many other large caps (including other airlines) Delta Air took a steep nosedive and is likely to have a hard time moving back to the upside.


UAL -- United Continental looks like it has an important support test coming up.

Monday, January 14, 2019

What Does The C Chart Say After Today's Report

Citigroup reported before the market's open this morning and rose a bit over 4% over the course of the day.  While many market commentators breathed a sigh of relief, pay attention to the $60 area... It should be pretty good resistance.